A few days ago I ran across this report from MITRE. It’s titled “2020 CWE Top 25 Most Dangerous Software Weaknesses”. I found the report lacking the sort of details I was hoping for, so I’m going rogue and adding those details myself because it’s a topic I care about and I like seeing conclusions. Think of this as a sort of modern graffiti.
Firstly, all of my data and graphs come from the NVD CVE json data. You can find my project to put this data into Elasticsearch then doing interesting things with it on GitHub here. All graphs are screenshots from Kibana.
The first step was to try to reproduce the data MITRE used. They’re not exactly clear how this worked from reading the report. They claim to have used 2018 and 2019 data to generate the 2020 report, but I couldn’t get my graphs even close using that data. It looks like if we use 2018, 2019, and what we currently have in 2020 we get pretty close. If I graph the top 25 of that data, here is what I get
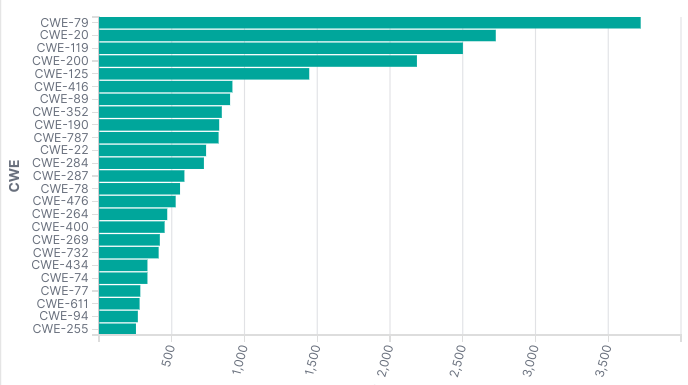
There are a few differences from MITRE’s data, but the graph is close enough to get started. Once we have this data in Elasticsearch we can quickly change our queries. Fast queries are the most important part of this project. If it takes hours to answer questions it’s easy to lose interest.
MITRE created a formula that takes CVSS scores into account to create a score for these flaws. They don’t explain why this score makes sense or what the purpose really is. I’ve already made my thoughts on CVSS public, but more importantly, I don’t understand how this score is useful so I’m not going to use it. The NVD data is good enough to draw conclusions from by just counting the number of CWE IDs.
The one other point of order is we need to look at the MITRE CWE-787 score. the NVD data shows 822 instances of CWE-787 using 2018, 2019, and 2020 data. If we include every year in the data we get a number closer to the MITRE score for CWE-787. I don’t want to make a big deal about it, I just want to point it out. The MITRE data isn’t public, I can’t be certain where that number came from, and the NVD data is quite a bit different. It won’t matter for reasons you’ll see below.
The first thing we notice is 25 CWEs is a lot. It’s more than I want to draw conclusions from, so let’s roll this back to a top ten which is slightly more usable as a human.
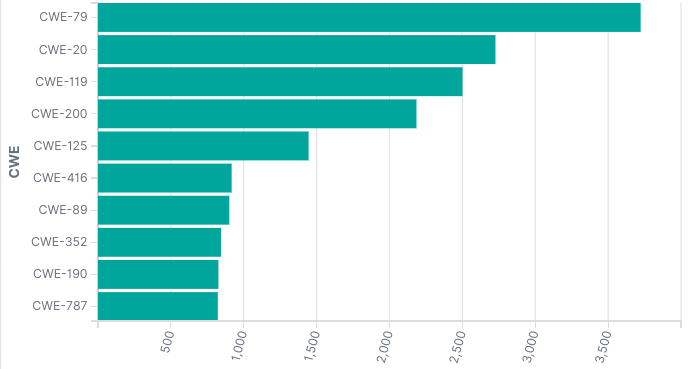
This top ten list is sort of a lie. I would call it a top 4.5 list.
First we have web based CWE IDs. CWE-79 is cross site scripting (XSS). CWE-352 is cross site request forgery (CSRF). And we can sort of include CWE-20 which is “improper input validation”. I will include CWE-20 in every other possible grouping, so it’s where our .5 comes from.
Then we have memory safety issues. CWE-119, CWE-125, CWE-416, CWE-190, and CWE-787 are all “C is hard” bugs. Integer overflows and memory problems (which are usually the result of integer overflows). We can probably include CWE-20 here also.
Then we have CWE-200: Exposure of Sensitive Information to an Unauthorized Actor which is too vague to be very useful to us. I would say that basically all security bugs could be CWE-200. Probably caused by CWE-20.
And finally there’s CWE-89: Improper Neutralization of Special Elements used in an SQL Command (‘SQL Injection’) which again could be caused by CWE-20. SQL injection is pretty easy to understand, no arguments here.
We could stop here and just give some actionable advice: don’t use C, and when you write your web apps, use a framework. This is pretty easy and solid advice. But since we can do whatever want with the data, let’s see what we can find. (You should still follow this advice)
I am determined to find some other lessons in this data, so let’s dig deeper.
I want to start with CWE-79 and CWE-352. Let’s look at these CWEs by year instead of trying to only look at 2018, 2019, and 2020.
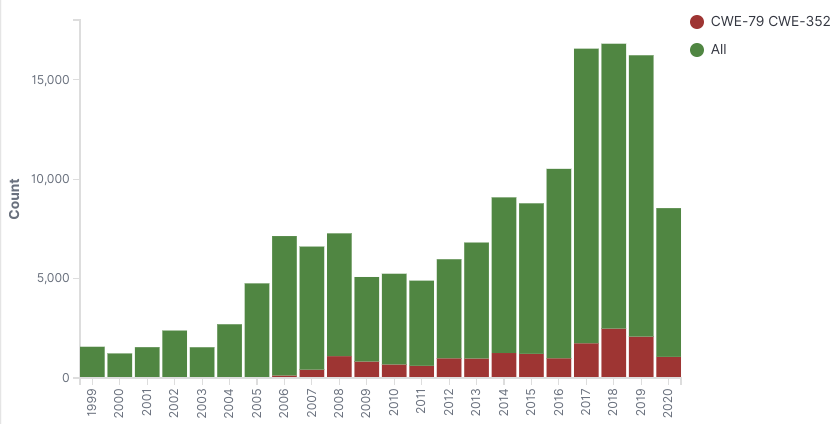
This data shows that for the last decade or so CWE-79 and CWE-352 have pretty consistently been around 15% of the CVE IDs per year. That tells us we’re not getting better or worse. Obviously getting better would be preferred, but not getting worse is still better than getting worse. My suspicion was this data would be getting worse.
The “C is hard” bugs looks about the same except it’s about 20% of issues
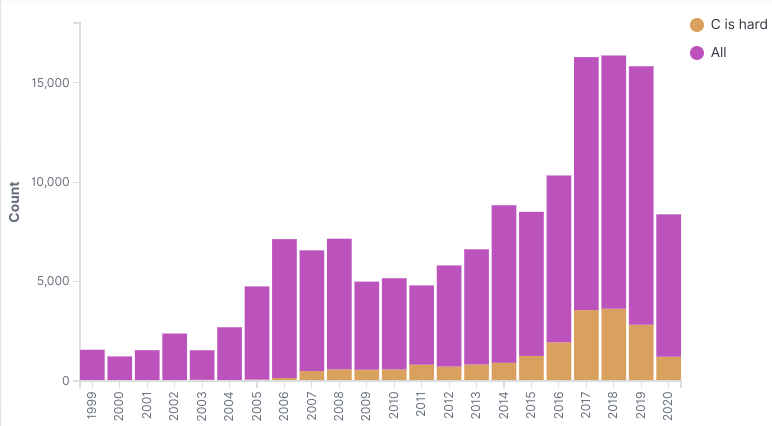
I really expected this to be getting better per year. C use is supposed to be in decline. I looked to see if Microsoft and Linux were keeping this number high, but removing them doesn’t drastically change anything. The reality is we’re still using a lot of C and C has a lot of problems. C is hard.
If you just thought “I’m special and smart and my C is OK” you need to stop reading now and go reflect on the life choices that got you here.
I’m a bit annoyed at this data. I want to find a lesson in here, but I feel like I can’t. Every CWE I look up is basically the same percentage per year, every year. I had one last question which was what if I graph the top 5 CWE IDs against all the CWE IDs per year?
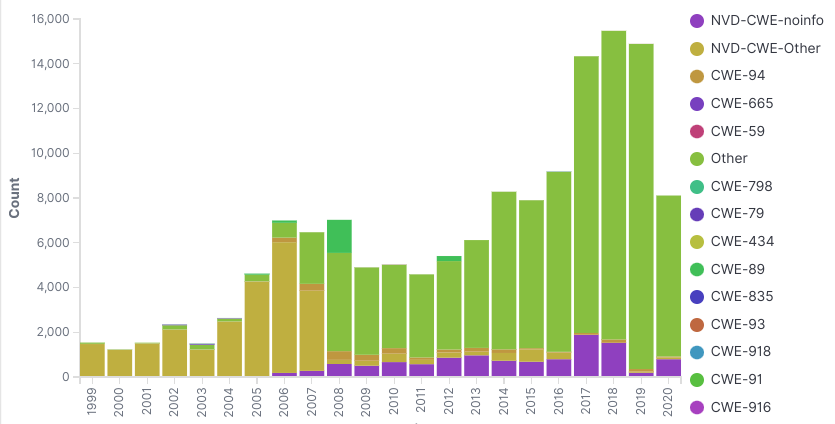
Holy cow, now we have something that looks exciting! However, this data shows us we can’t really draw conclusions from the NVD data. Sometimes a non finding can be the finding.
Let’s break the graphs down. If we look at the left side, the NVD-CWE-Other data just means we don’t have CWE names for that old data. CWE didn’t exist back then, so that makes sense.
The big section on the right is the “Other” collection. The “Other” bars are all the CWE IDs that aren’t in the top 5 for a given year. We can see the VAST majority of issues fall outside the top 5. Even if we graph the top 25, the majority are still “Other”
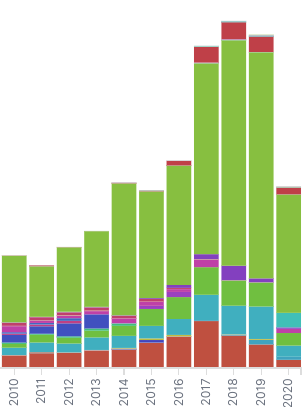
It’s possible there are just too many types of security problems and we will never have enough useful data we can draw conclusions from. I hope that’s not true. I think if we could better measure this data we could learn lessons from it, so we should find a way to measure it.
There is an effort to minimize the number of CWE IDs used. CWE view 1003 “Weaknesses for Simplified Mapping of Published Vulnerabilities” is trying to do just this. The idea is to have 127 CWE IDs used instead of 1248. Over 1000 CWE IDs is not particularly useful especially when a lot of them overlap. Using the power of Elasticsearch we can figure out there are 193 unique CWE names in the NVD data today. Of the 148,559 CVE IDs 86,173 are currently mapped to the CWE-1003 view. 62,386 are not mapped to CWE-1003. I feel like this is a reasonable place to start, but it’s going to be a high hill to climb.
I think there is one very important takeaway from this data, but it’s not what I had hoped it would be. If we want to rely on this data as an industry, we need to improve it. I use “we” a lot, and in this case it’s not the royal we, it’s literally you and me. The whole security industry is using the NVD data in all of our tools. There are policies and decisions being made based on this data. I cover how scanners are using this data in a previous blog post.
The data needs to be improved if we are going to rely on it. The current state of the data is preventing us from making progress in certain places. Have you ever looked at an automated security scan? Part of the reason the results aren’t great is because the NVD data isn’t great. I need to change my talking point from “security scanners produce low quality results” to “security scanners only have access to low quality data”.
If this is a topic you care about, I would suggest starting with the CVE working groups. There is a lot of work to do. If someone who knows more about this than I do has ideas for how to help, let me know.
